Most of these are software implementation partners in the US, with 1 to 2 leaders on the system. Straight from their own LinkedIn accounts. Where a number went down, we left it in.
10 new conversations with buyers, started every month. Typical, counted in the CRM, never guaranteed. One client has passed 100 buyers who asked to talk in two years. The views below are what make that happen.
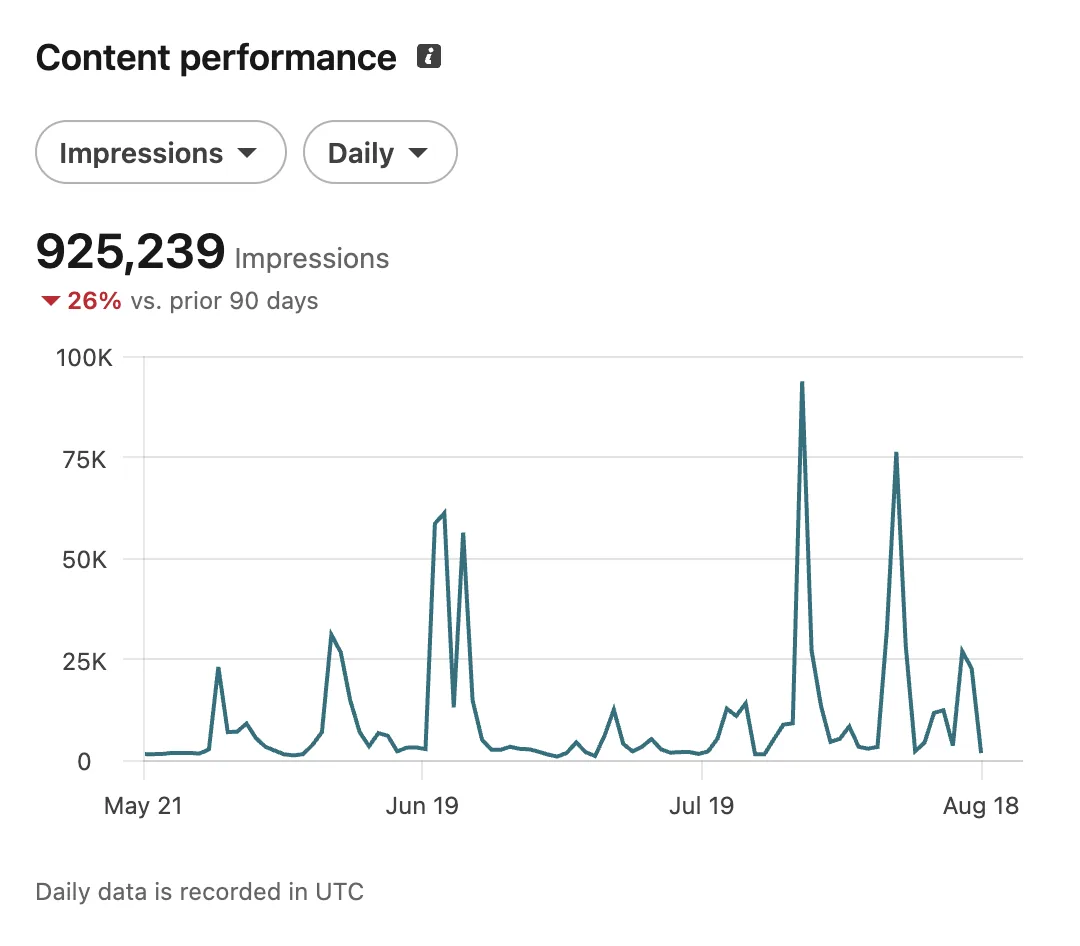
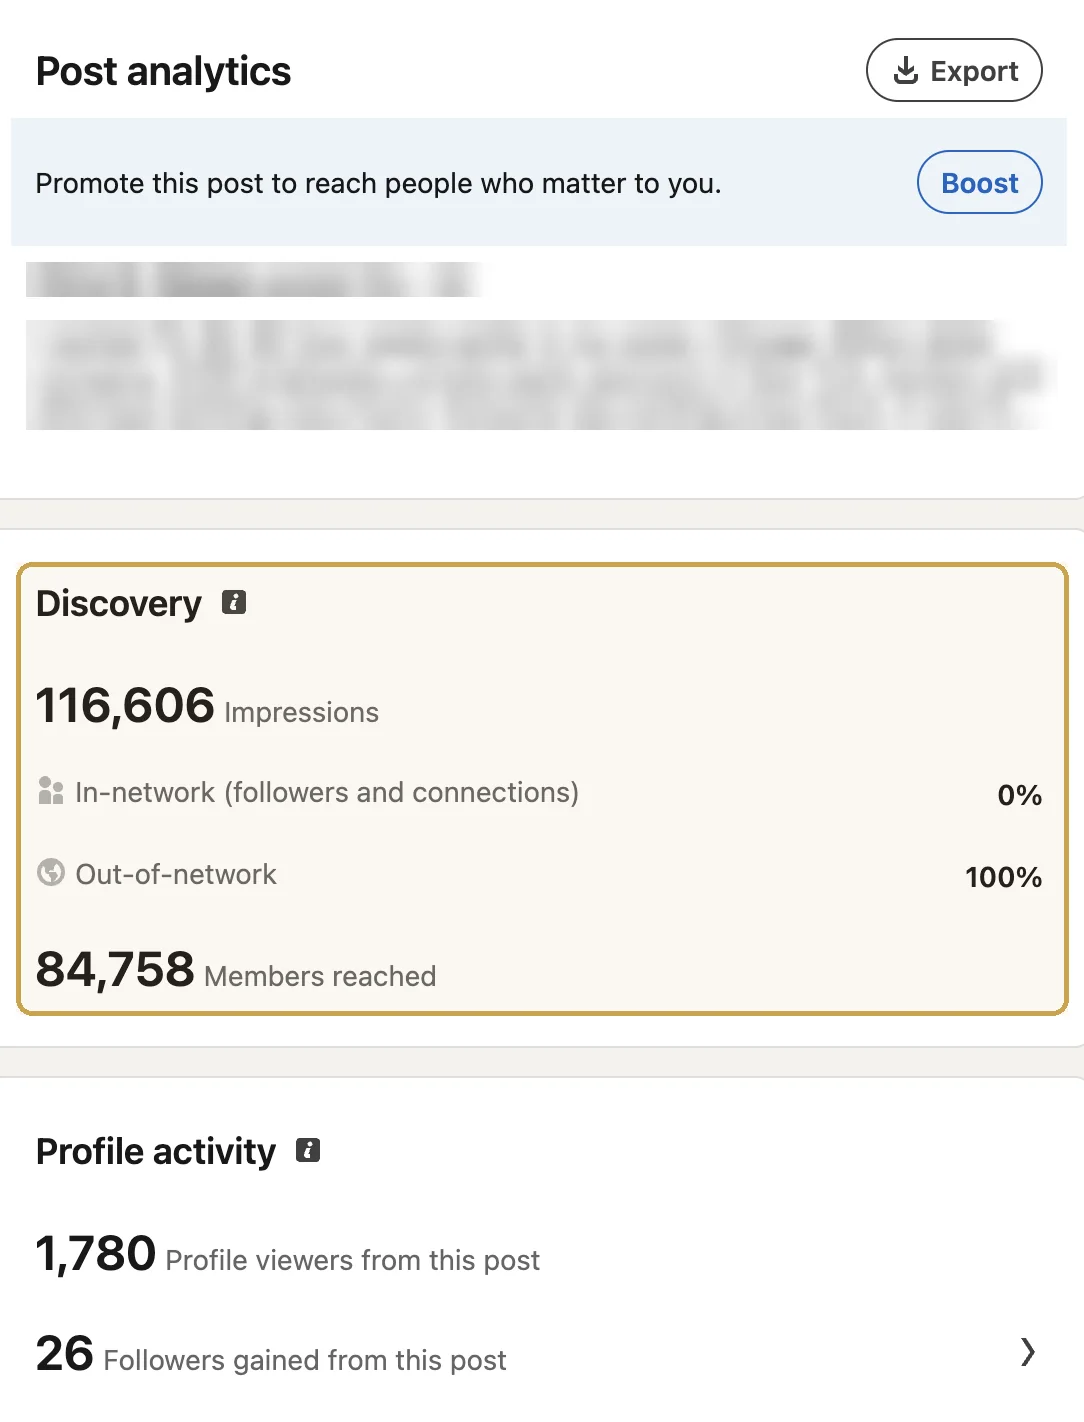
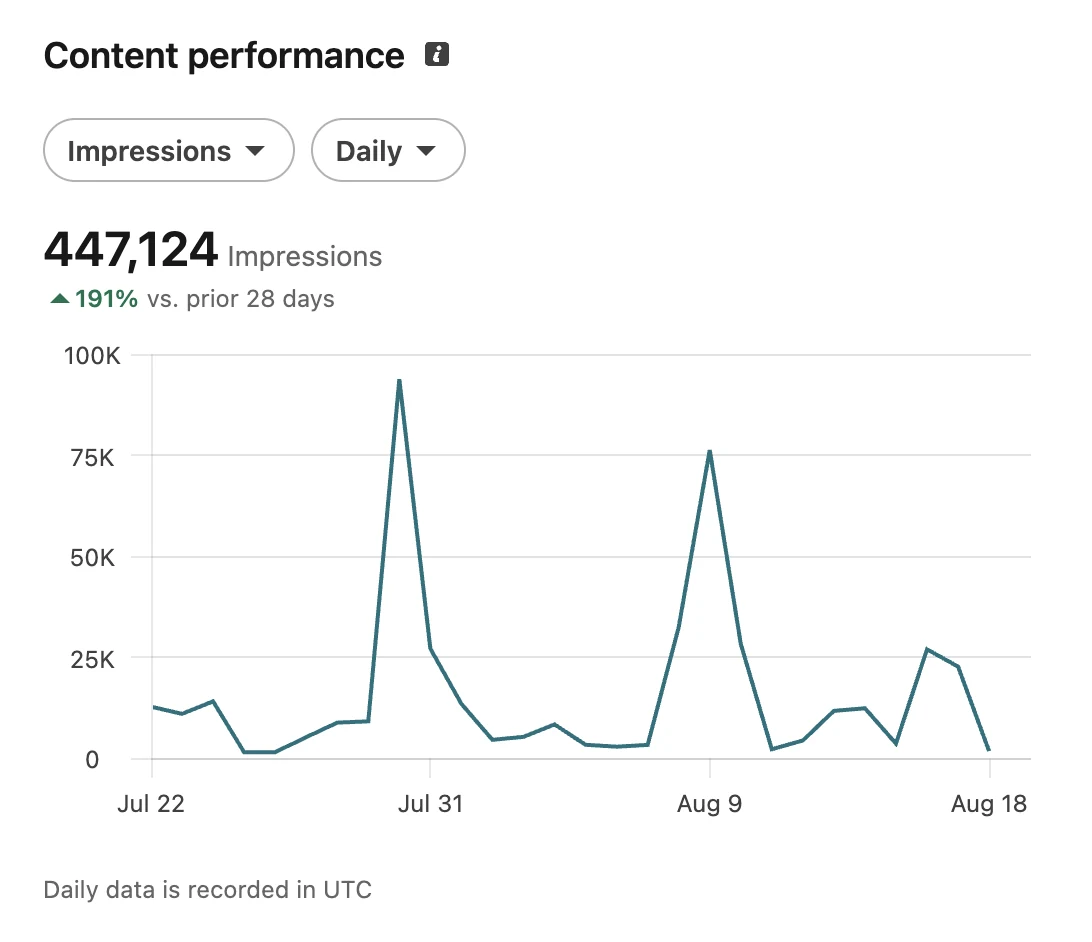
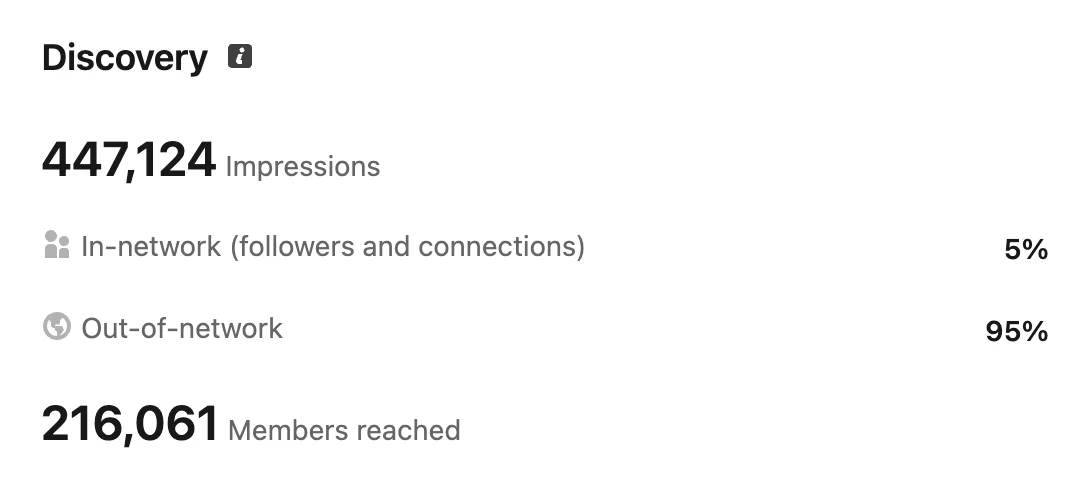
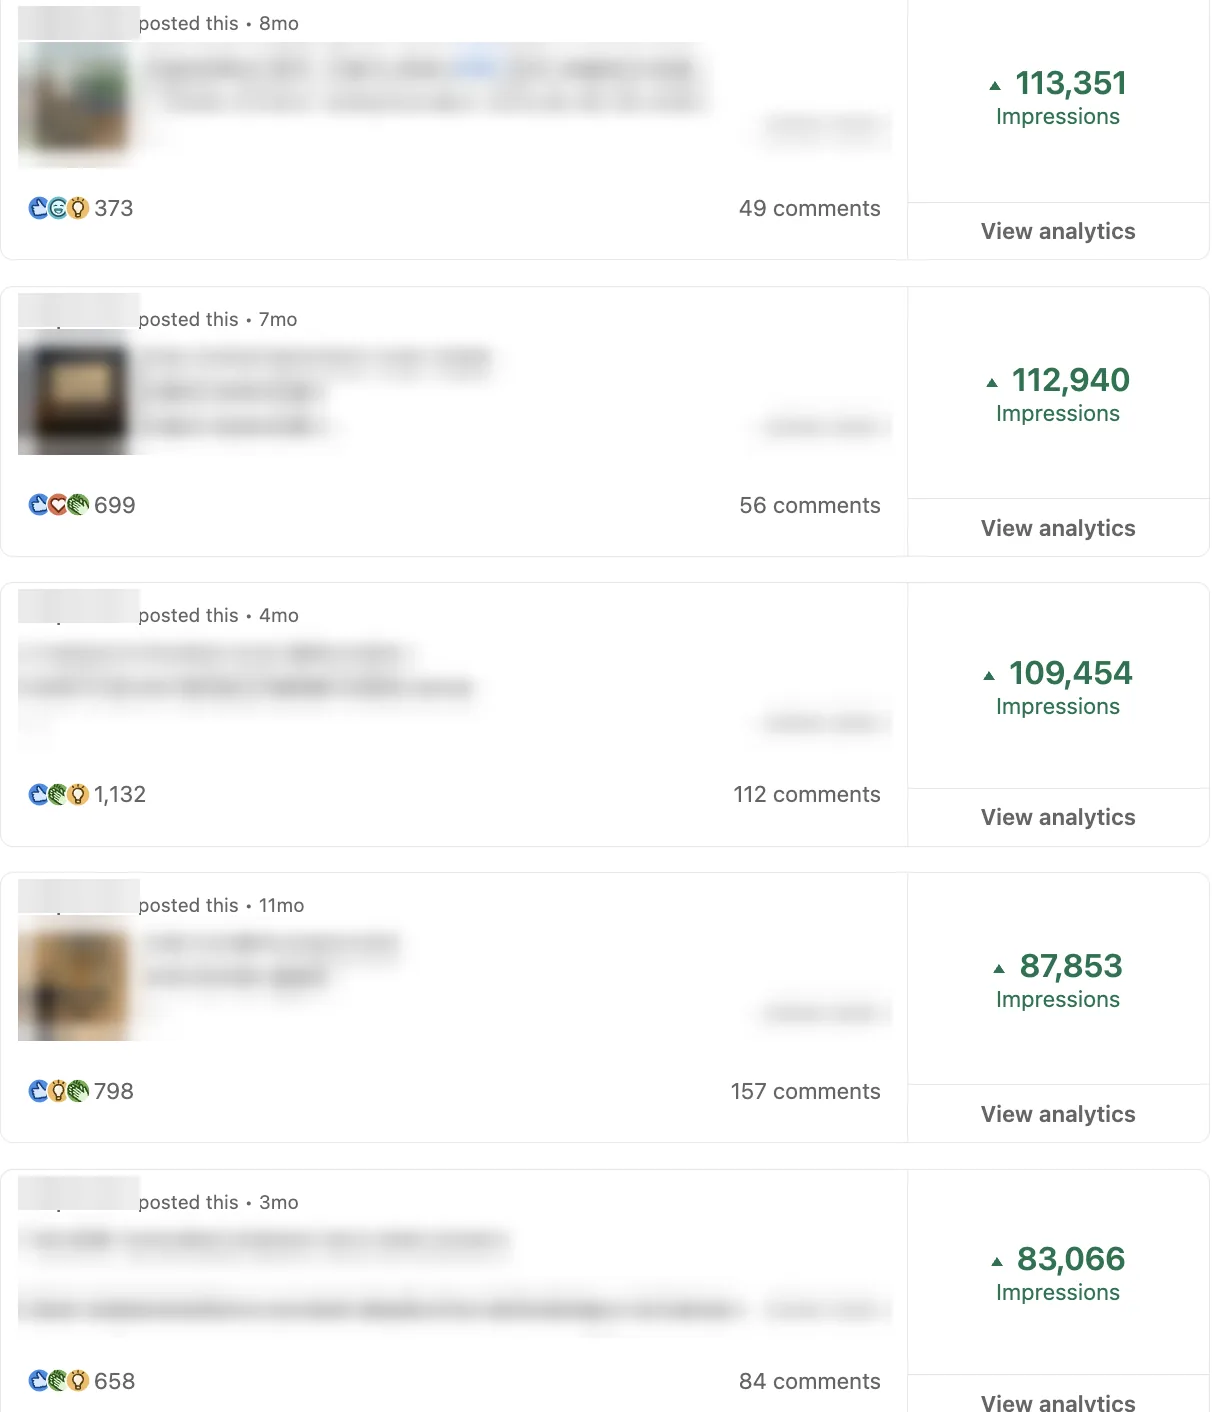
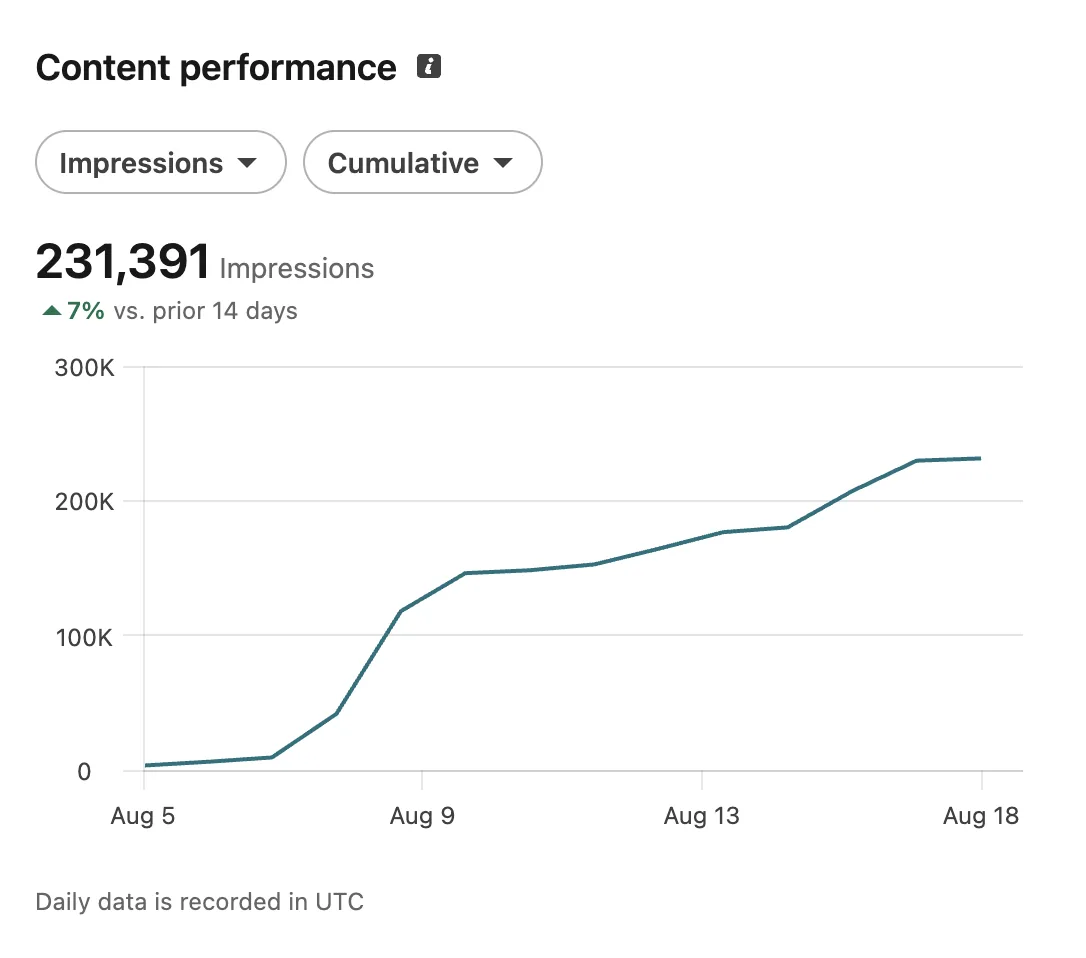
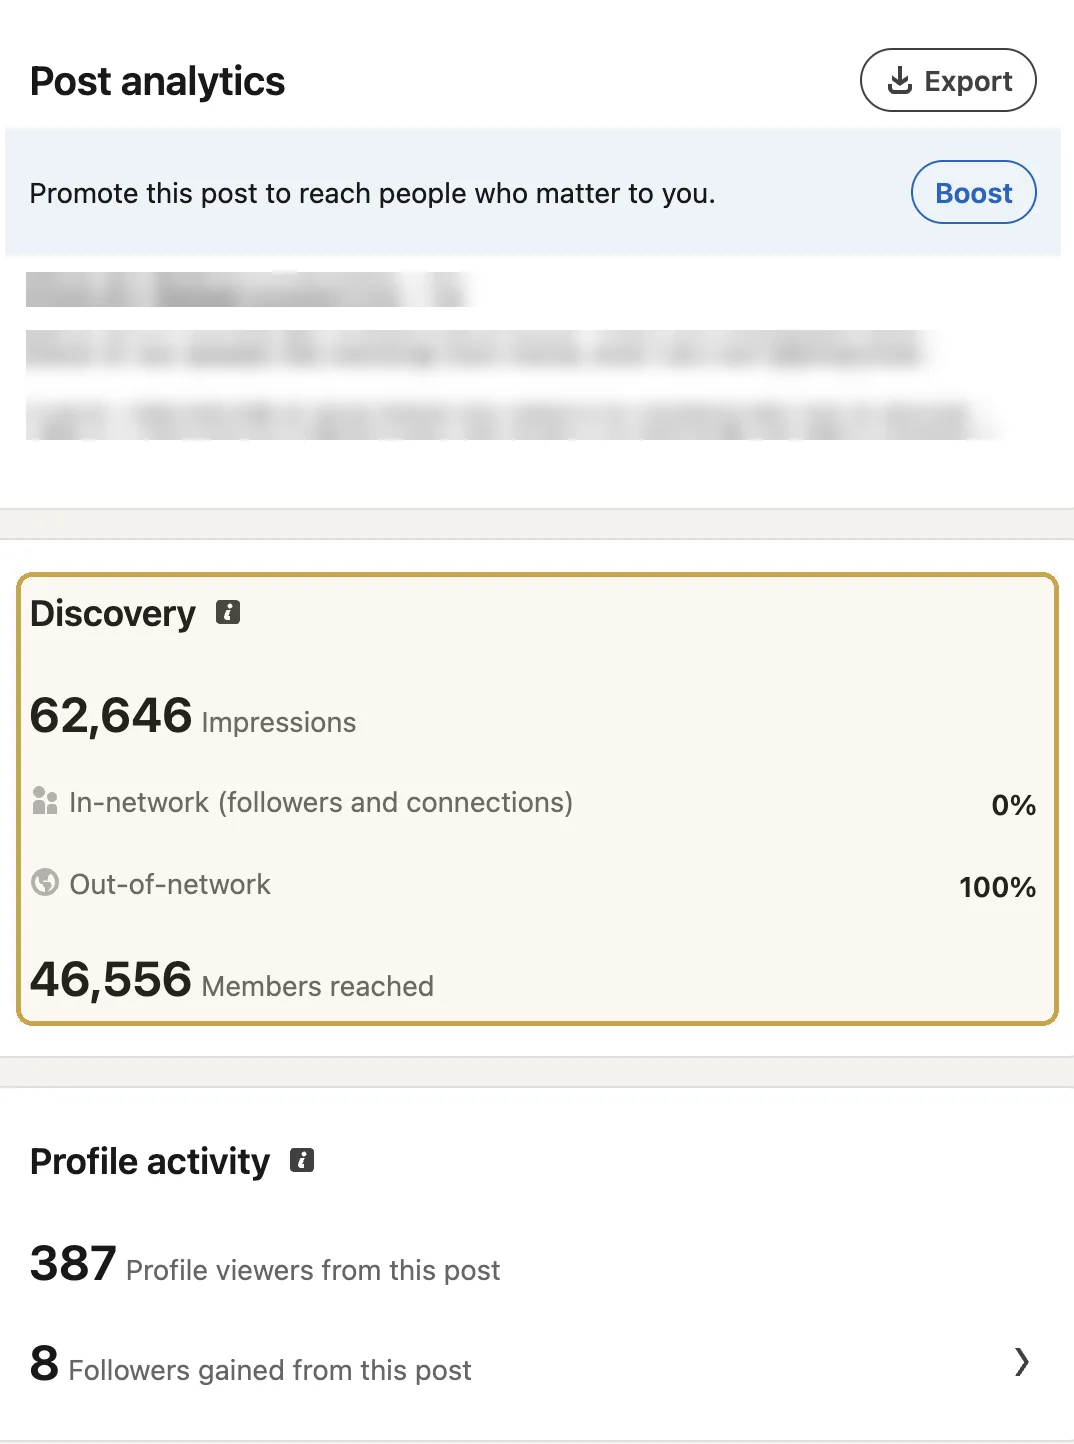
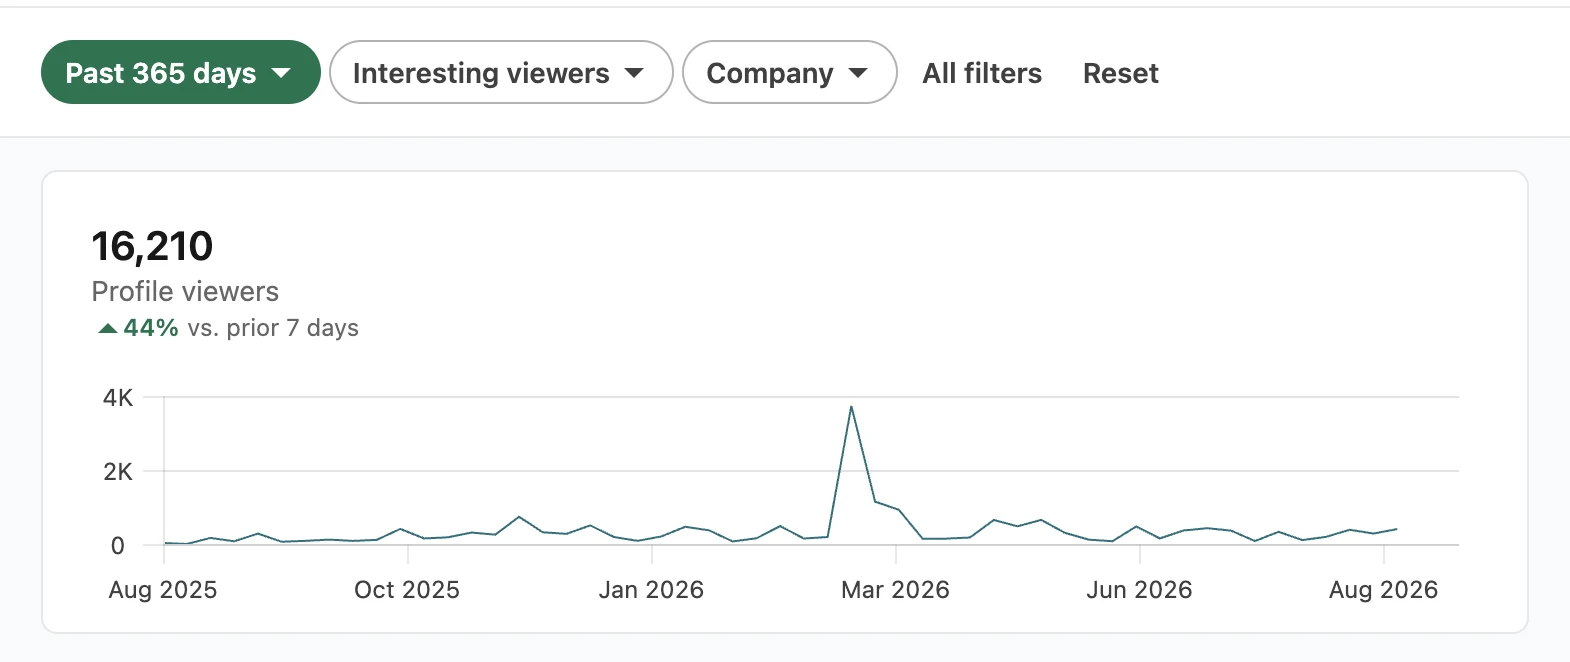
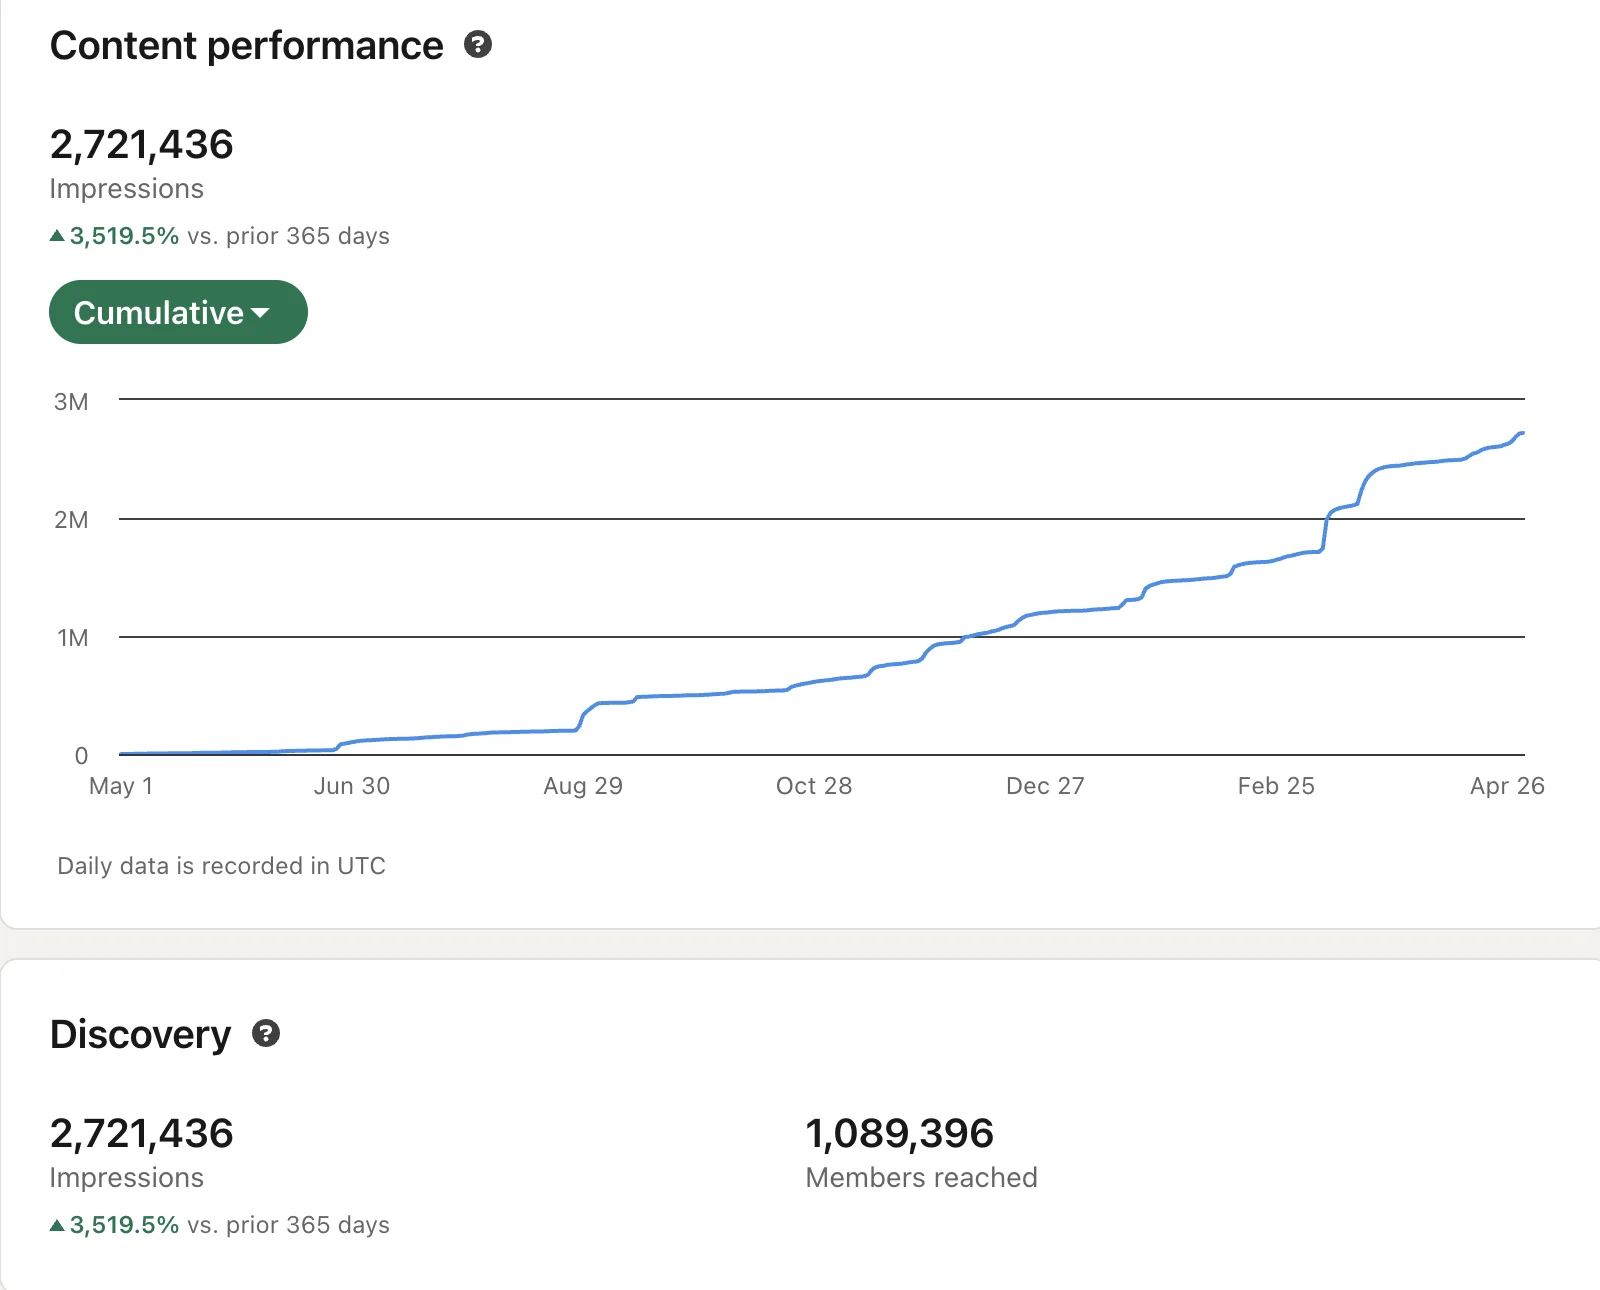
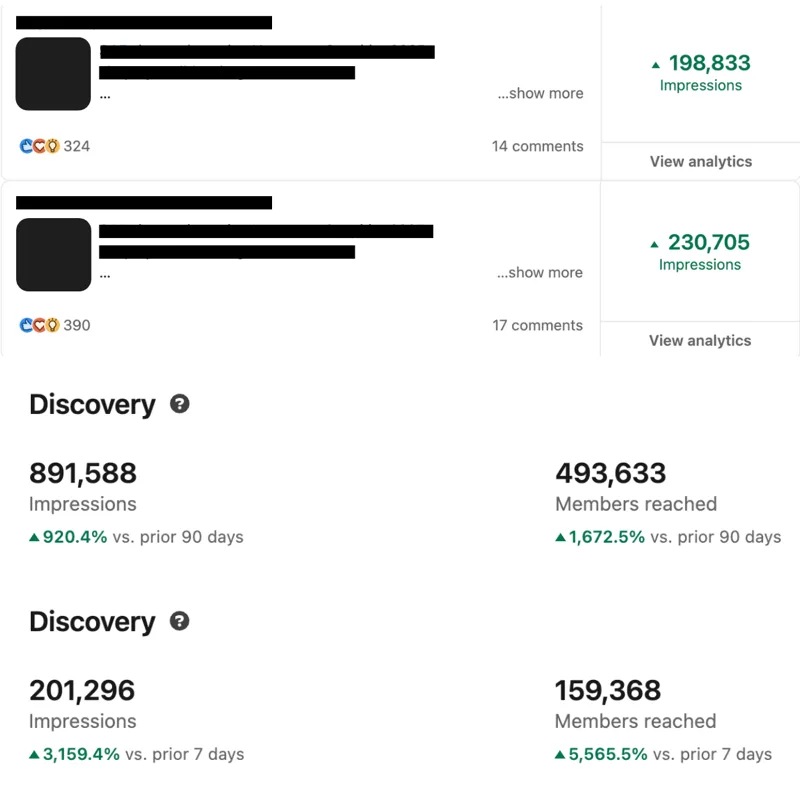
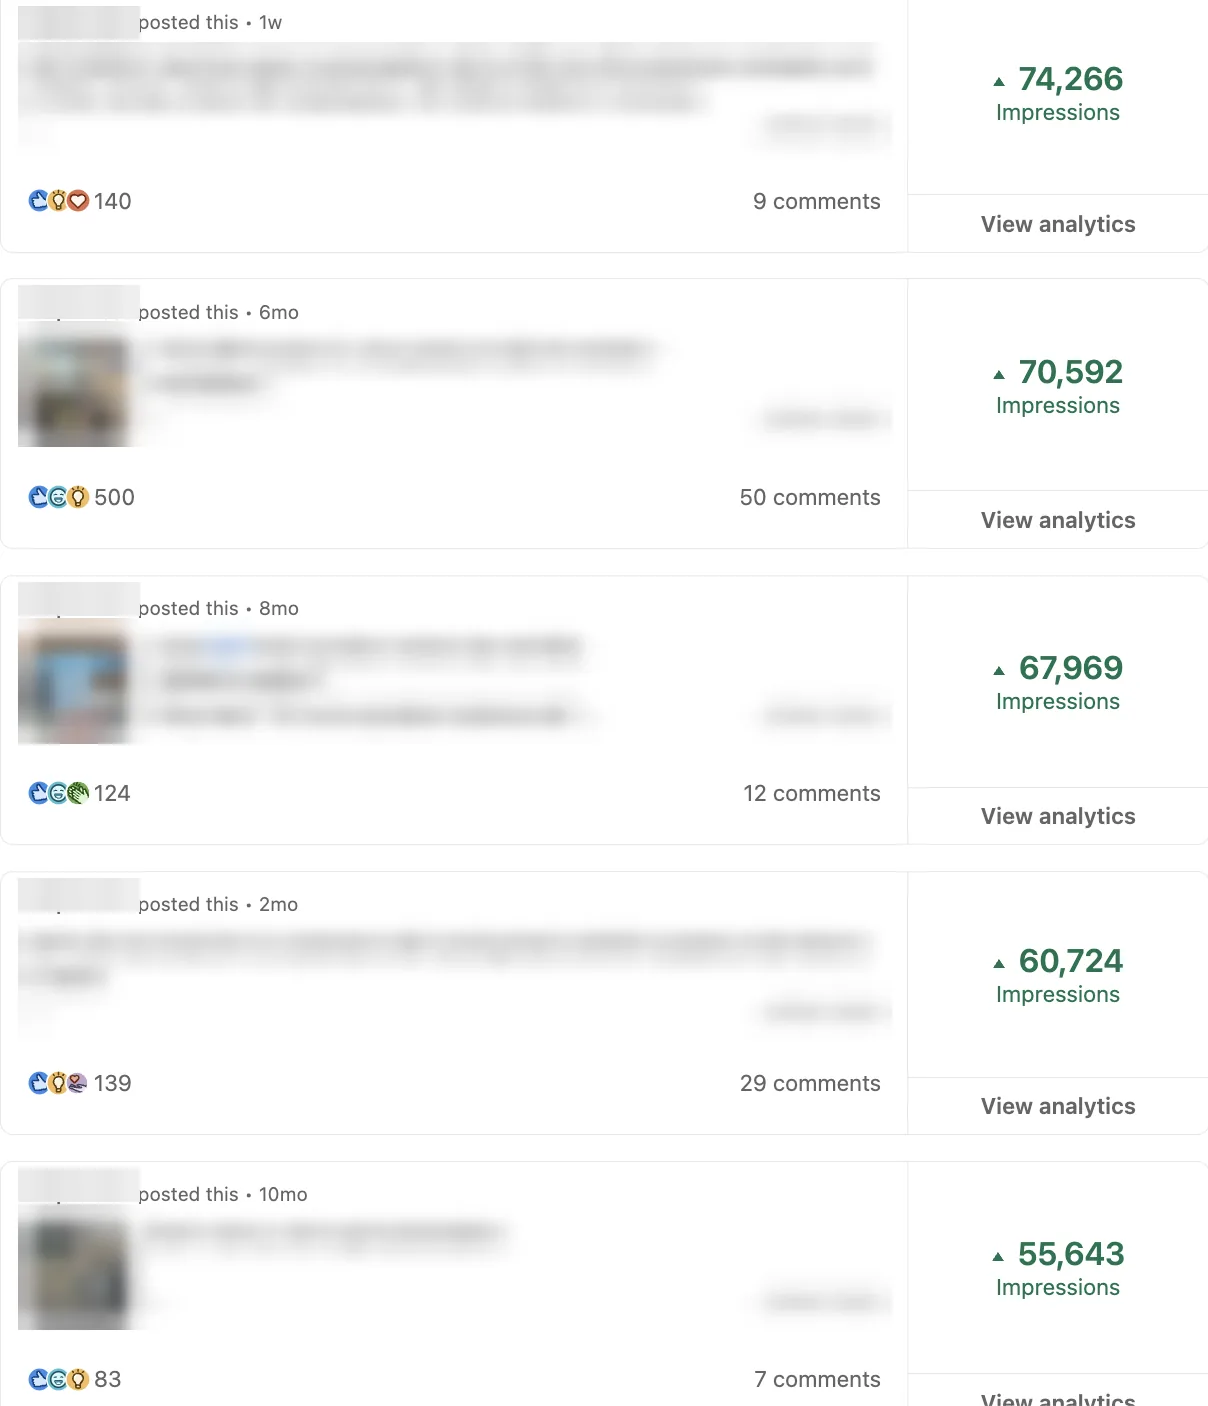
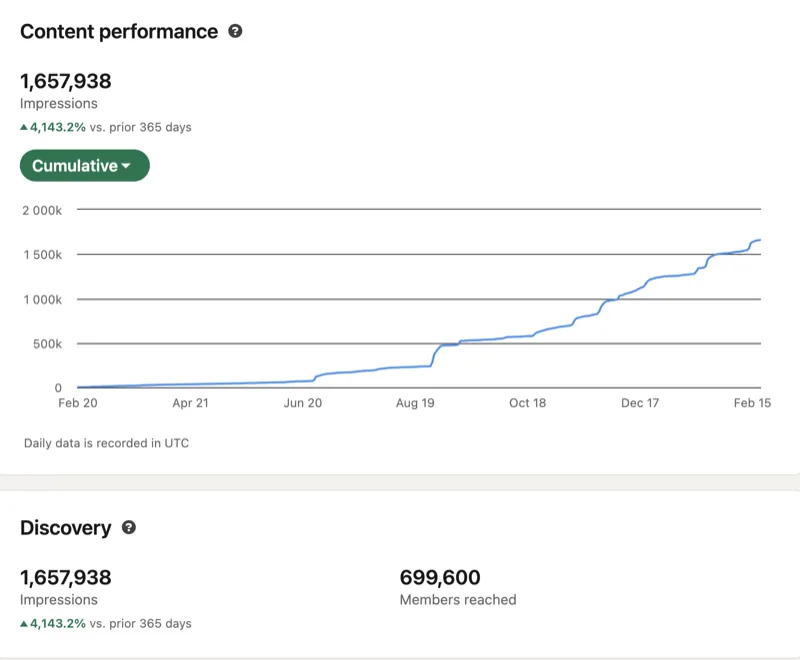
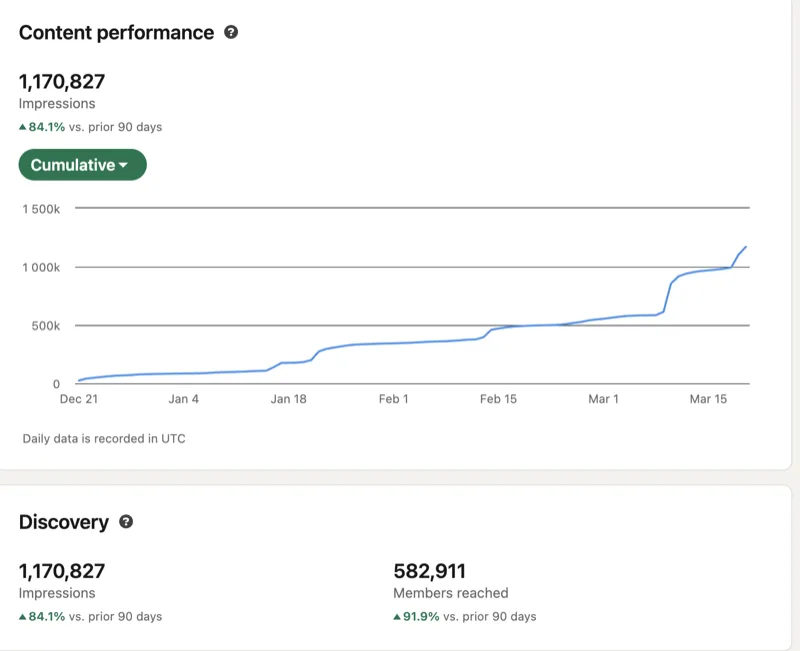
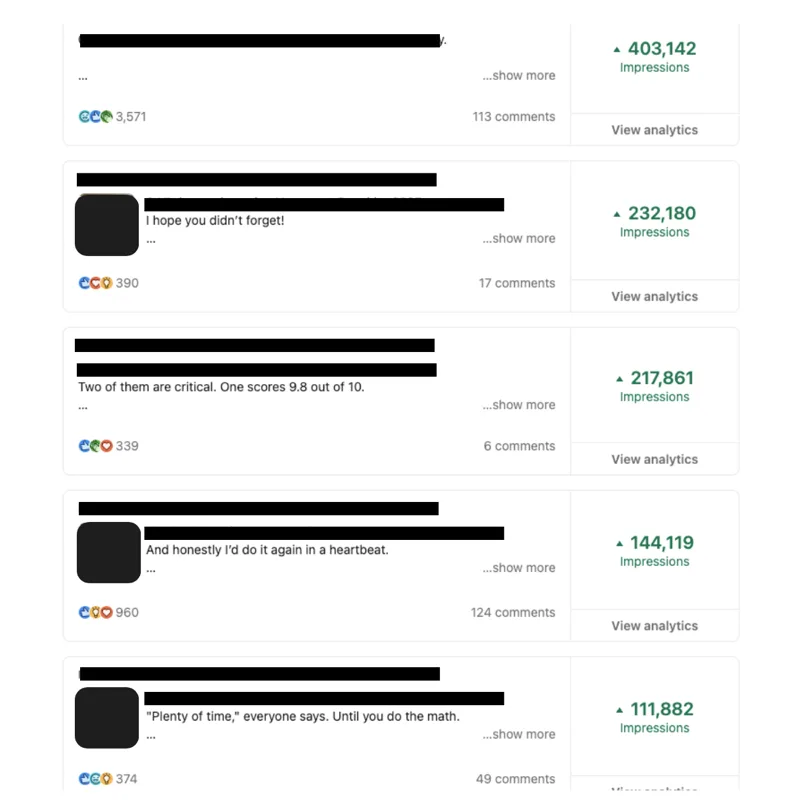
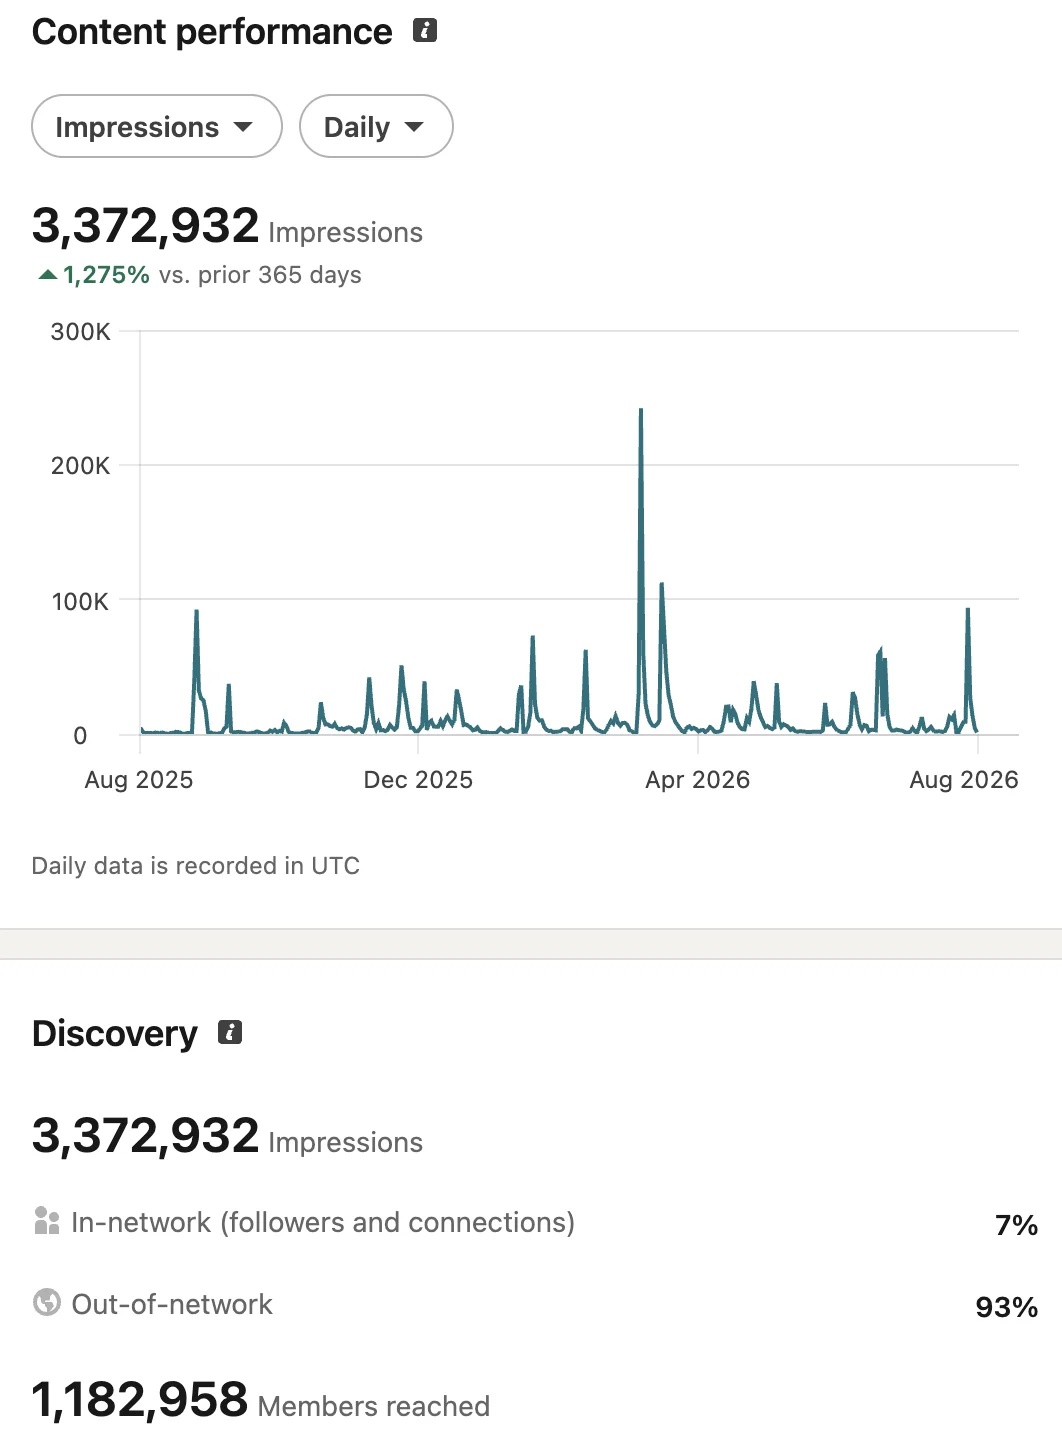
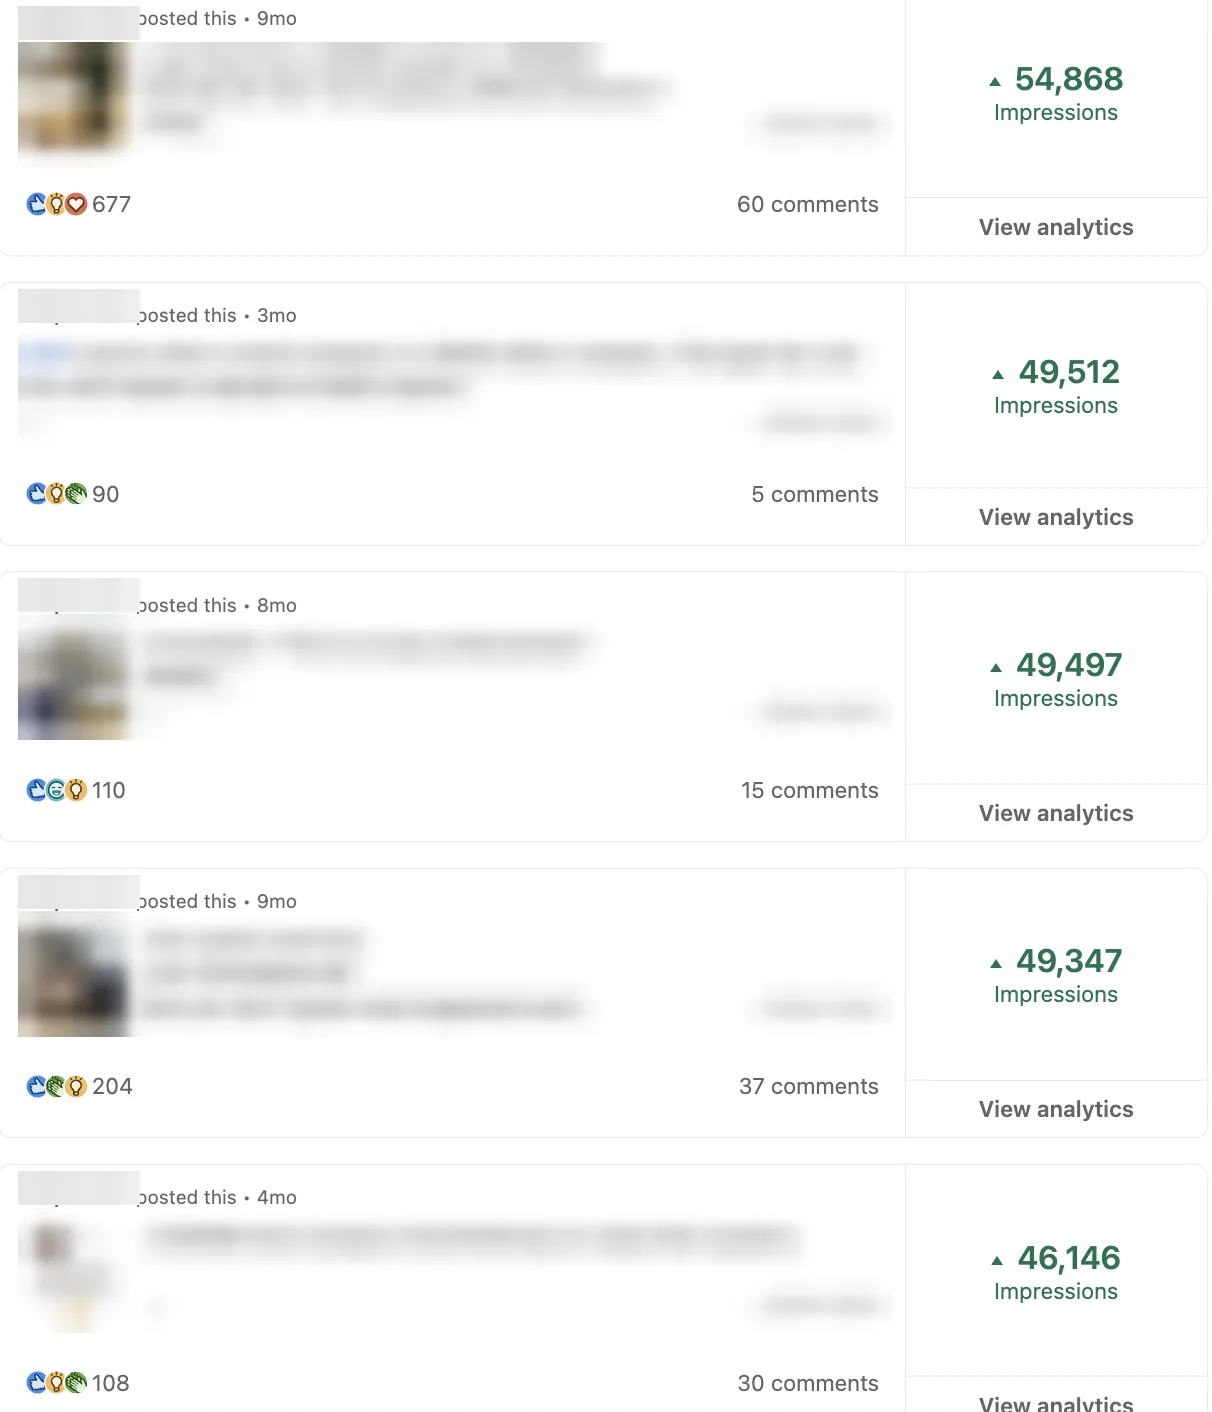
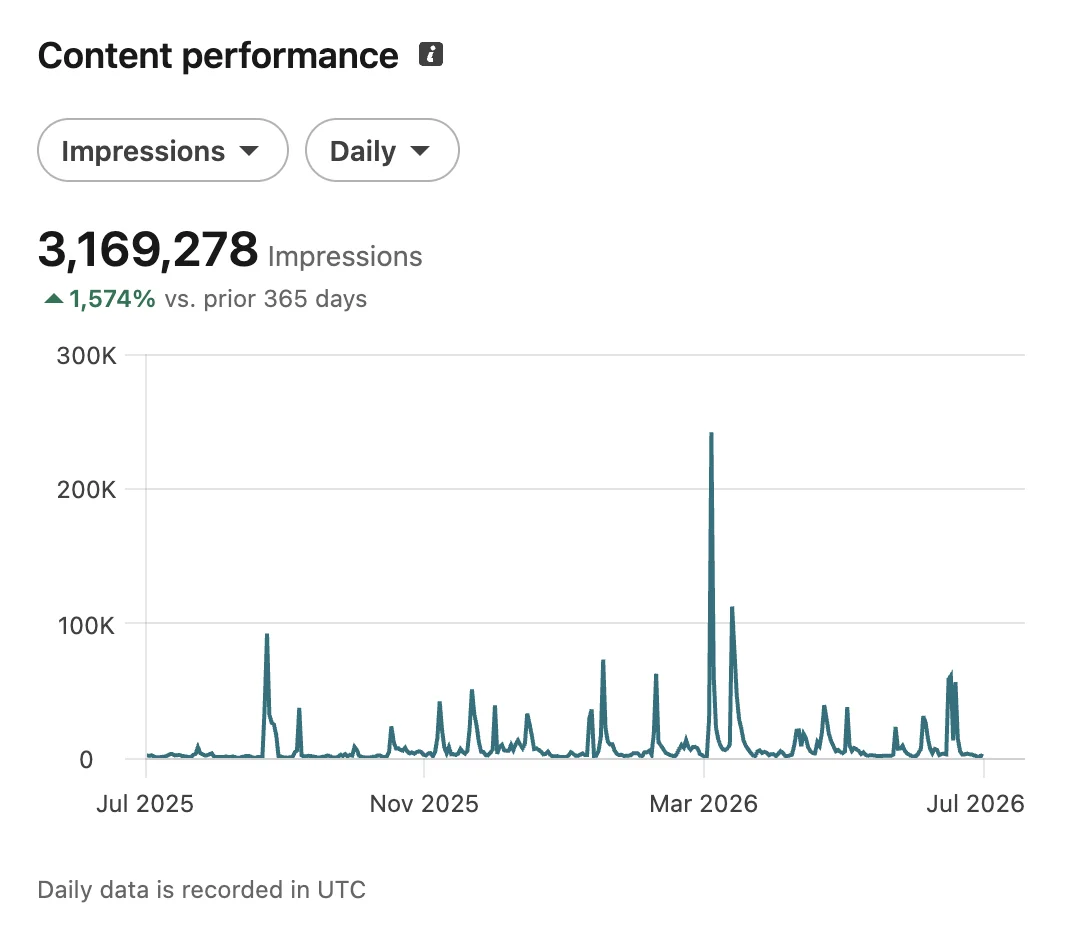
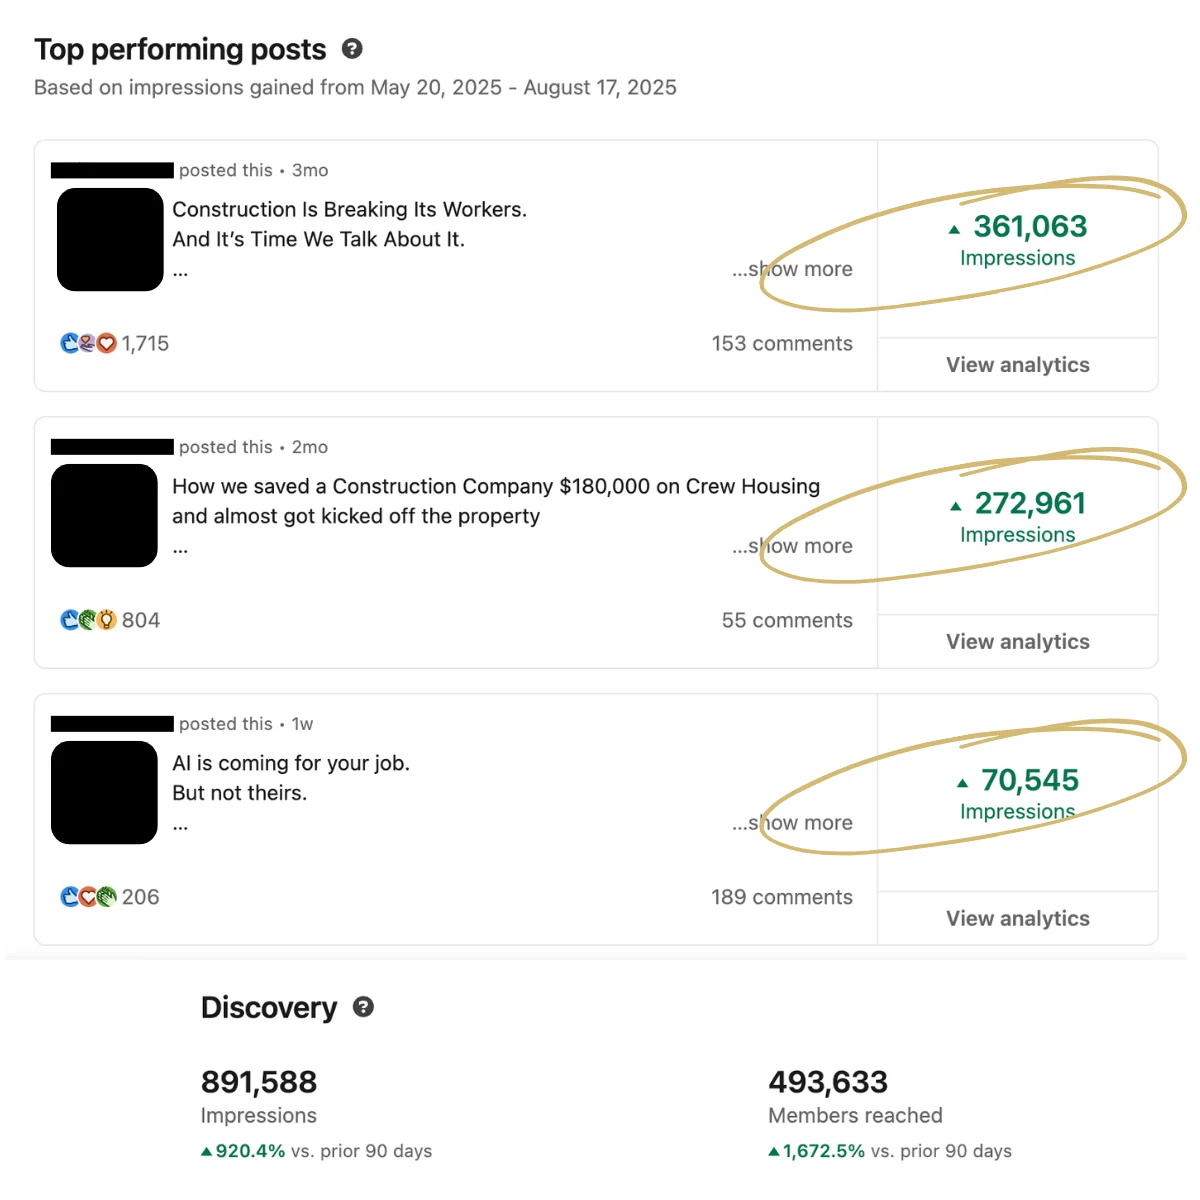
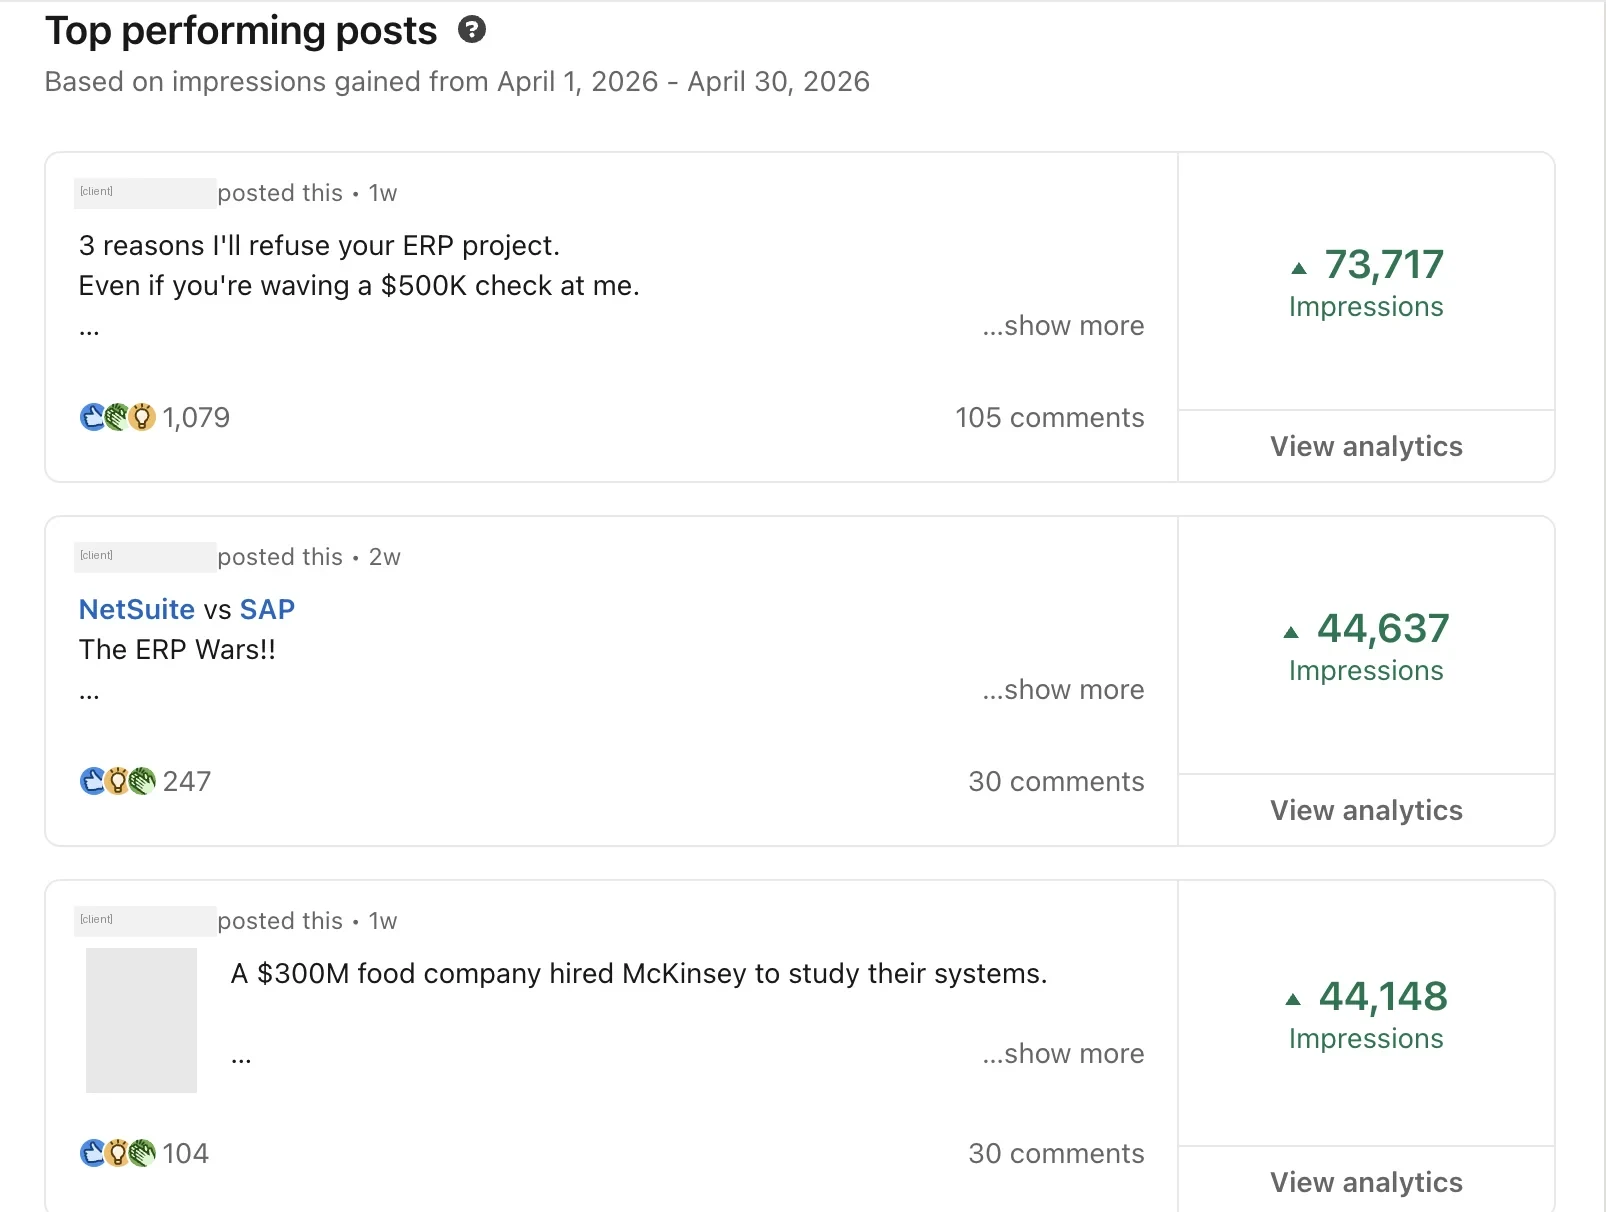
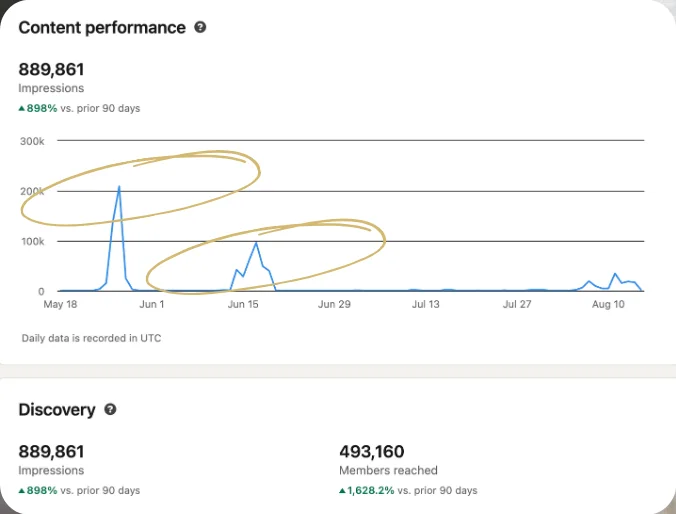
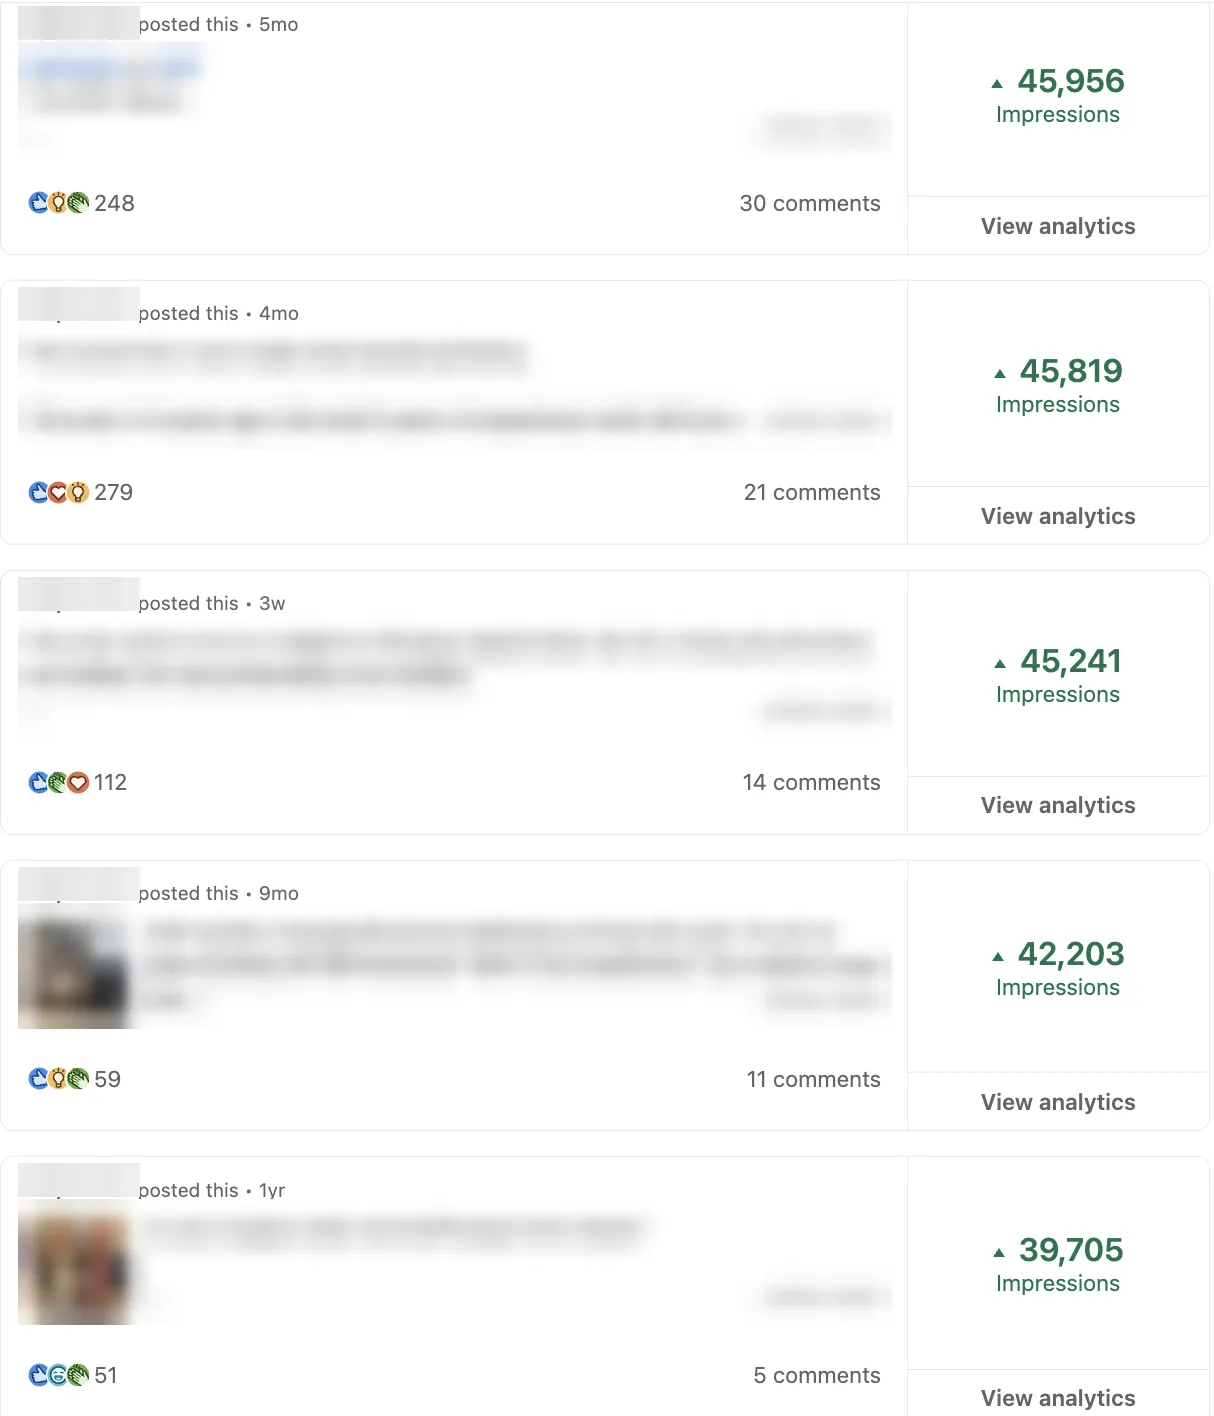
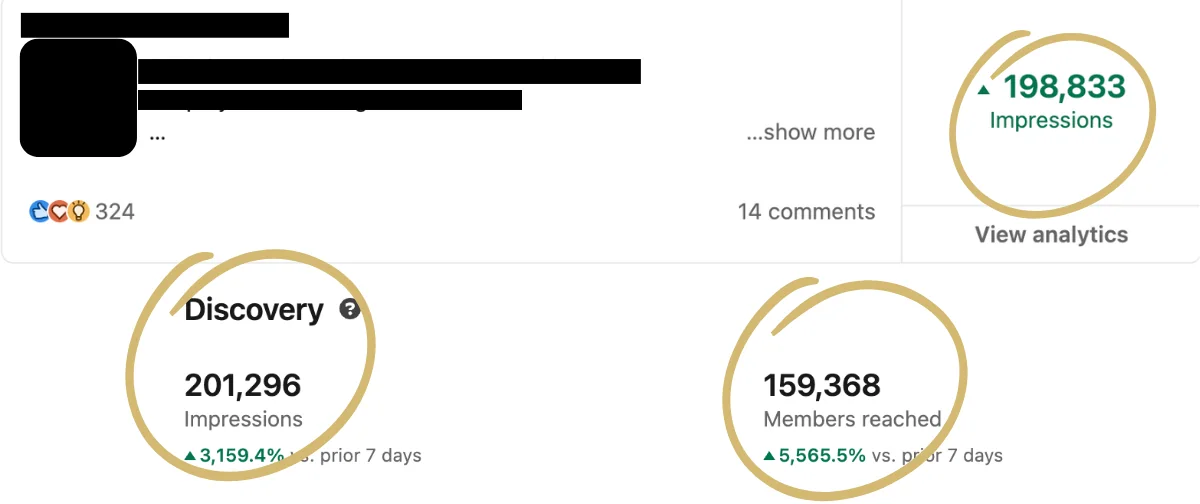
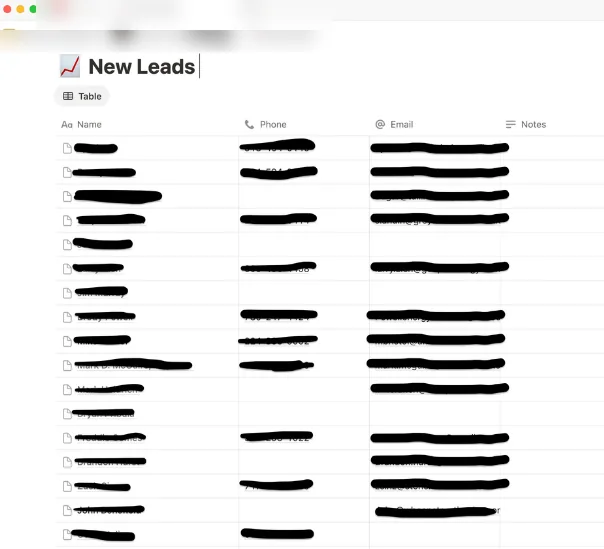
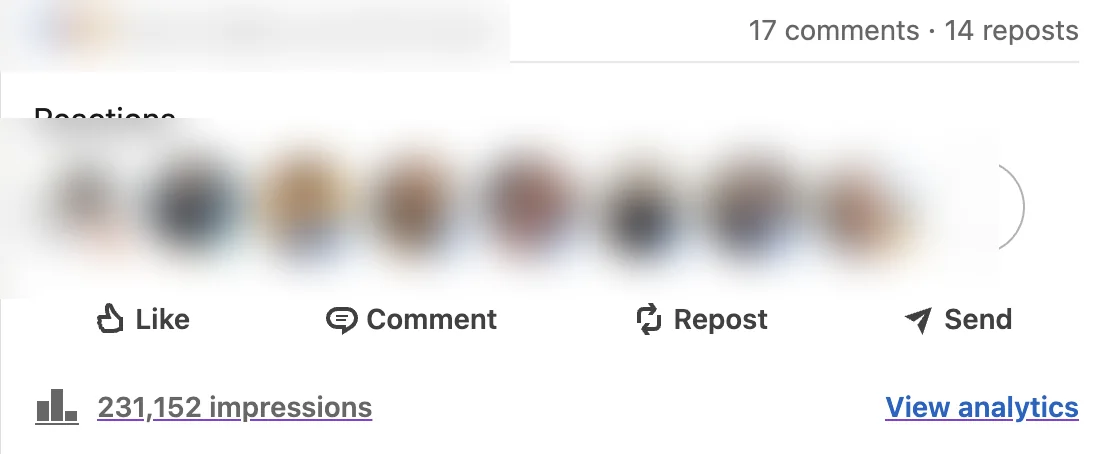
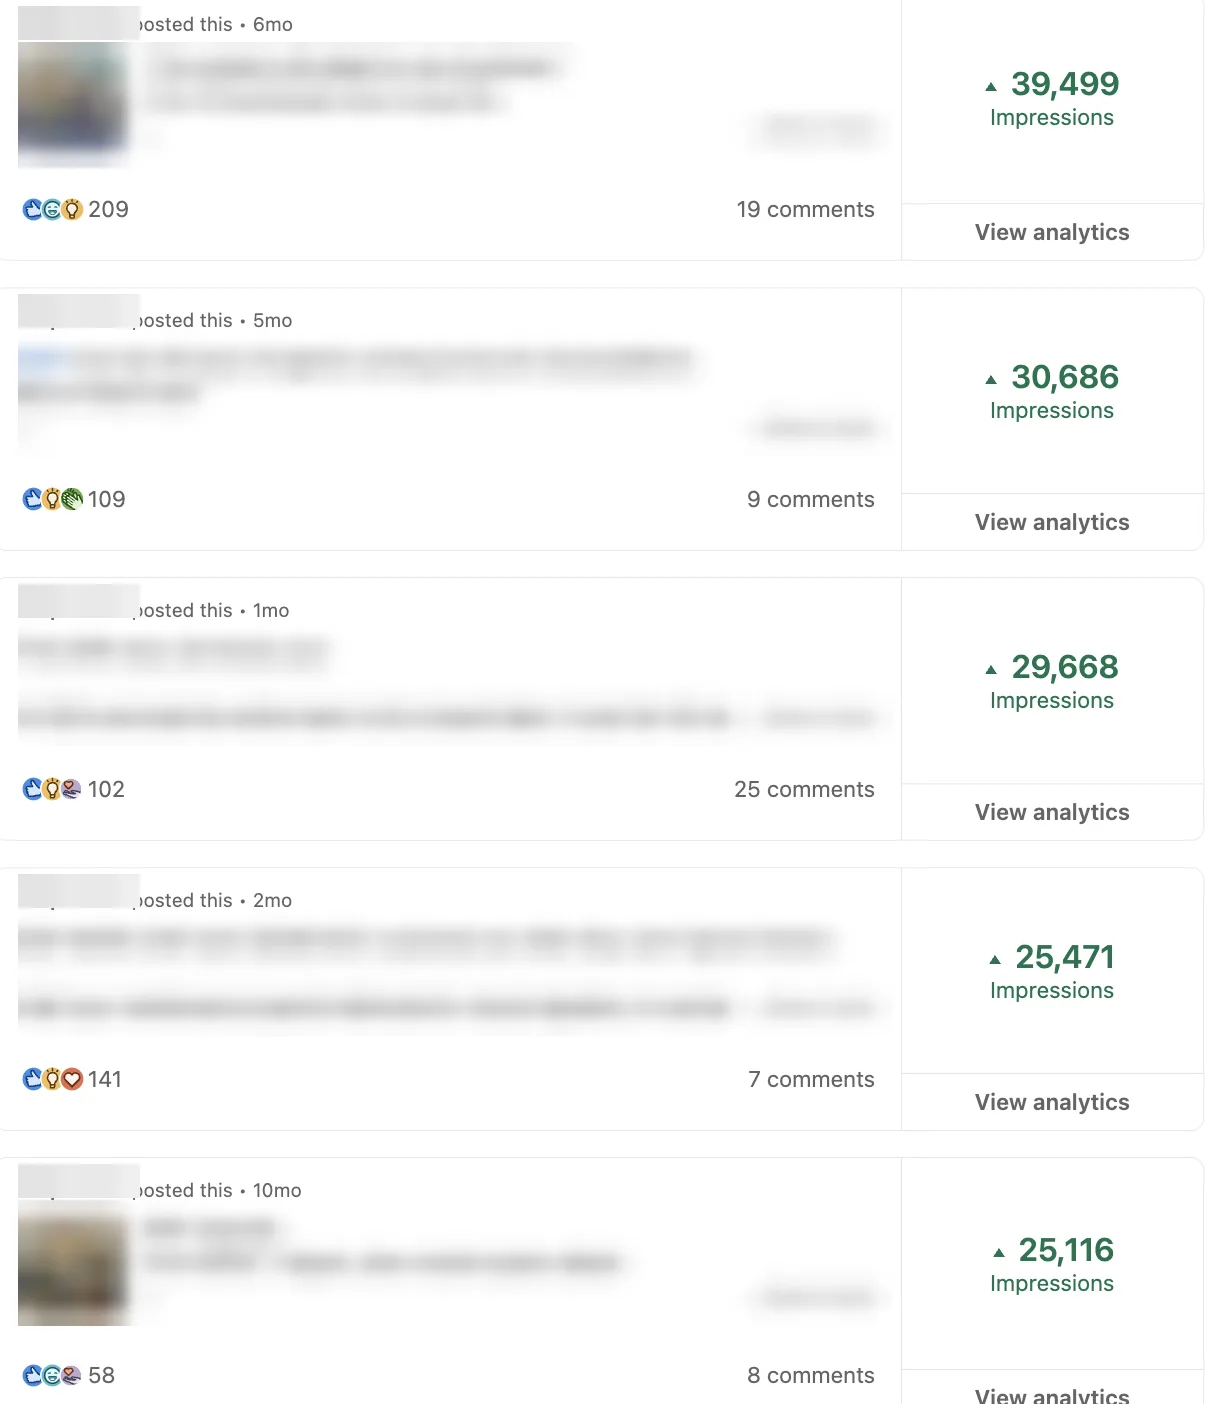
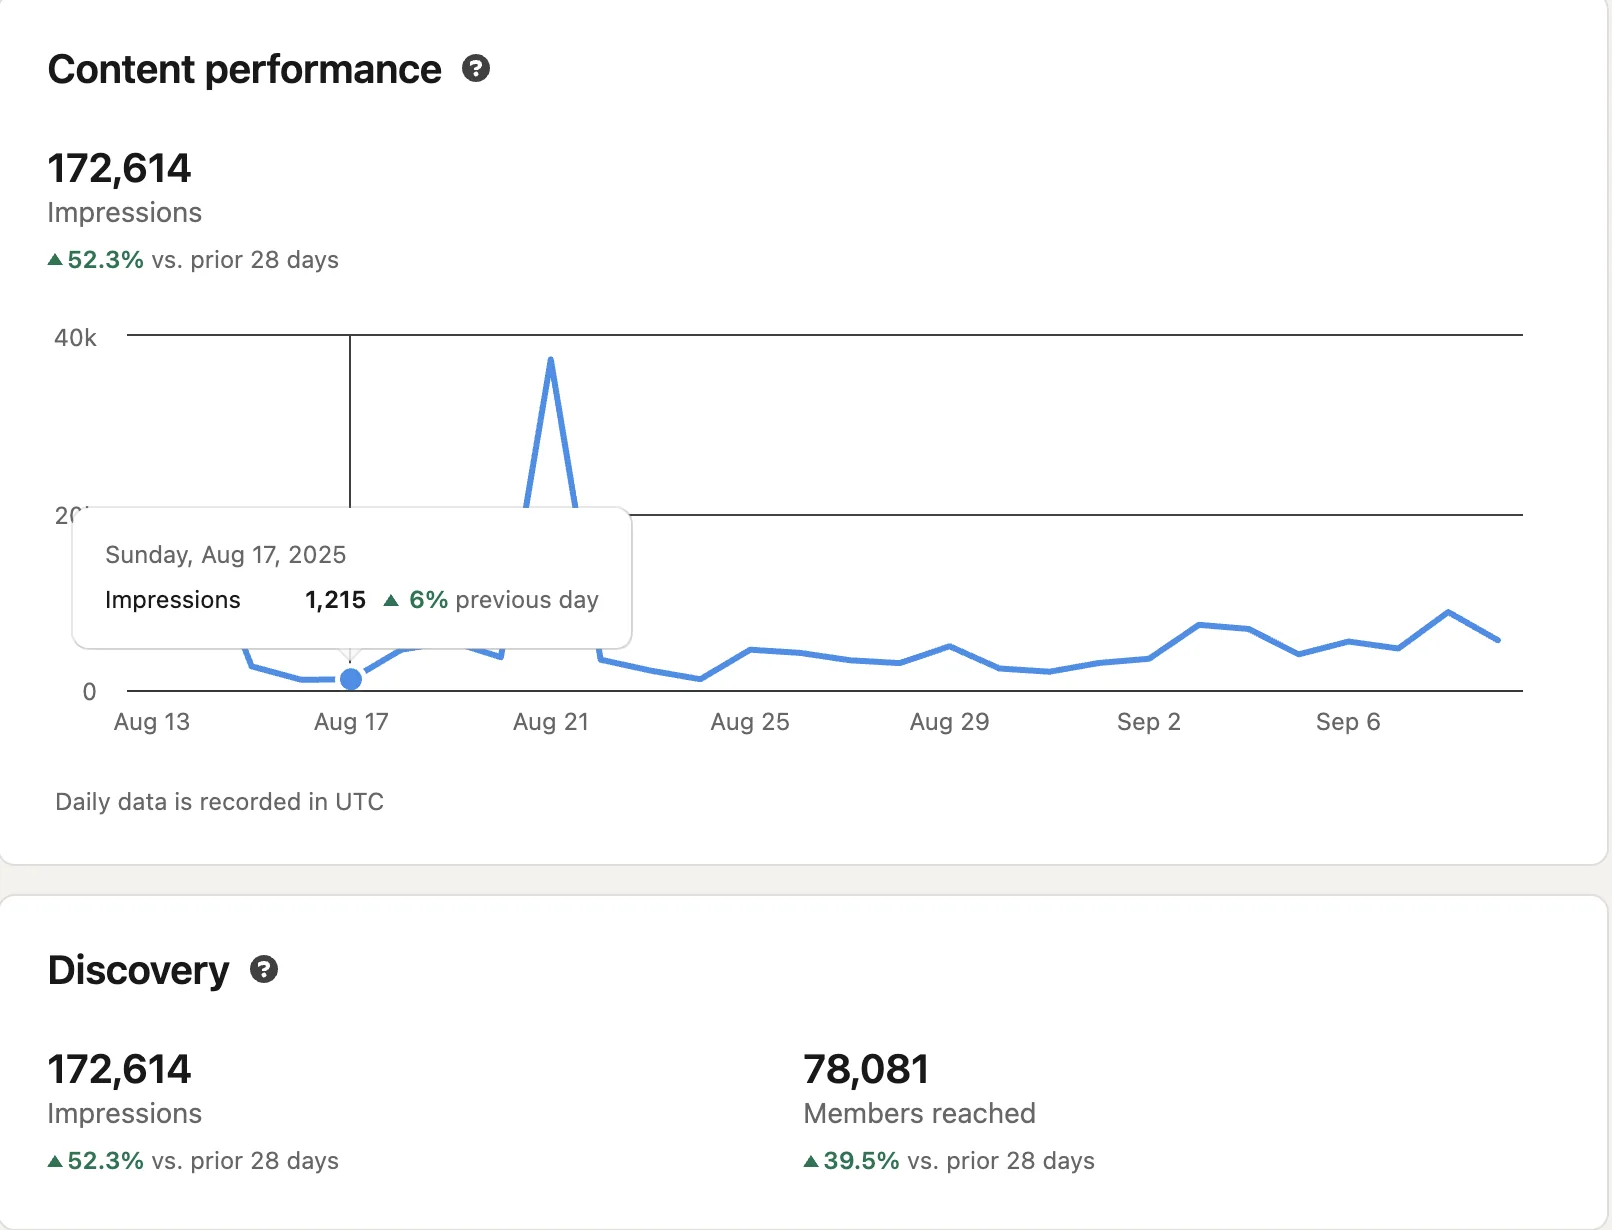
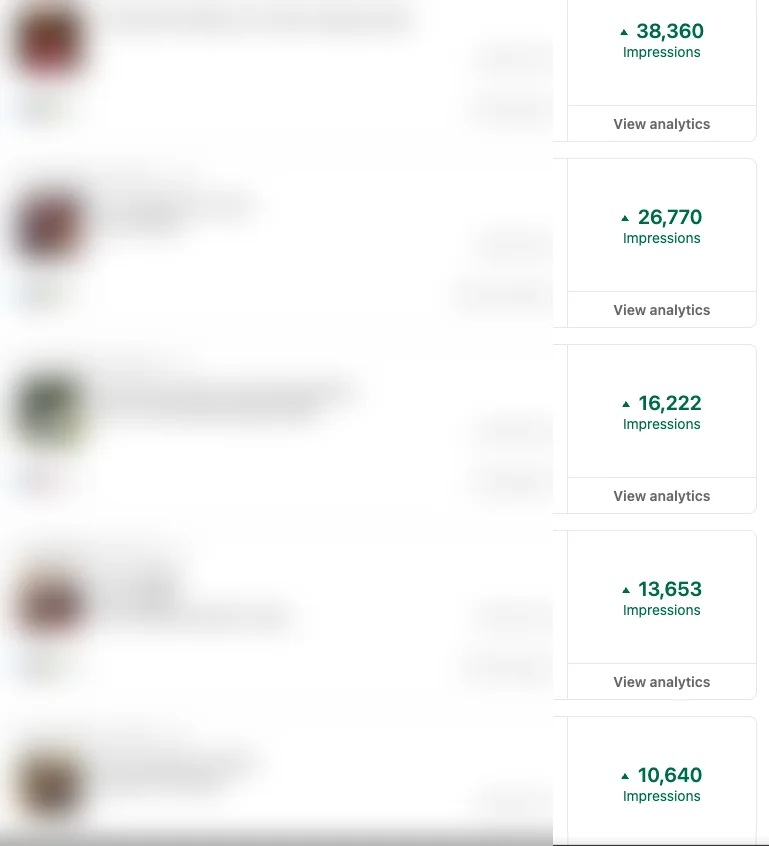
The same partner across 90 days: 925,239 views. You can see it dipped against the quarter before. The month after this shot it was up 191%, which is what a real account looks like.One post: 116,606 views, and every one of them out of network. 84,758 people reached who do not follow him. 1,780 of them went and looked him up. Name and post blurred, the post is still live.An enterprise software implementation partner, one month: 447,124 views. Up 191% on the month before.The same month: 95% of it went to people who don't follow him. 216,061 people, and almost none of them were already in his network.Five posts from the same partner: 113,351 down to 83,066 views each. Names, pictures and the hooks blurred, because the posts are still live.Two weeks of the same account: 231,391 views. Climbing the whole way, day after day.Another post the week before: 62,646 views, again 100% out of network. 46,556 people reached, not one of them already following him.The same account: 16,210 people went and looked him up. A year of buyers reading his profile to work out who he is.The same partner, one full year: 2,721,436 views. Over a million people saw his work.Two posts for the same partner, 198,833 and 230,705 views. That account did 891,588 in 90 days.Five more: 74,266 down to 55,643 views. One of them went out last week.An enterprise software implementation partner, one year: 1,657,938 views. 699,600 people reached.The same enterprise software partner, 90 days: 1,170,827 views.Five of his posts in a row, 403,142 down to 111,882 views. Not one of them flopped.An enterprise software implementation partner, one year: 3,372,932 views. 93% of it reached people who had never followed them.Five more, all between 46,000 and 55,000 views. Week in, week out.A year of the same account, day by day: 3,169,278 views. Spike after spike, so it was never one lucky post.His top posts: 361,063 and 272,961 views. Both written for the exact people who buy from them.One month for the same partner: 73,717, 44,637 and 44,148 views. Written for the exact people who buy from them.Another 90 days: 889,861 views, 493,160 people reached. Up 898% on the quarter before it.Another five: 39,705 to 45,956 views. The comment counts are the part buyers notice.One week: 201,296 views and 159,368 people reached. One post carried 198,833 of it.Another client's leads, as they came in. Names, numbers and emails blacked out, because they are real people. This is the part views are supposed to turn into.Three meetings booked in one day. Straight out of the inbox. We blacked out who they were, because they are somebody's customers now.One post: 231,152 views, 17 comments, 14 reposts. Faces blurred, because those are real people in the industry who stopped to read it.And the quieter ones: 25,116 to 39,499 views. Not every post is a hit. Most still reach tens of thousands of the right people.Another client, one month: 172,614 views, 78,081 people reached. Up 52% on the month before it.Another client's five best posts: 38,360 down to 10,640. Not every account does hundreds of thousands, and this one still put its owner in front of the right rooms every week.
That is what a year of this actually looks like.
If you want to know what it would look like on your own leadership team, we will map it out for you at no cost.